
Data isn't just numbers and charts. It's the voice of your customer, the pulse of the market, and the map to your destination. It tells you not just where your customers have been, but where they're likely to go next.
Marketing without data is like driving blindfolded. Scratch that. It’s like driving blindfolded in a car without a steering wheel. You may miraculously make one or two correct turns, but you will eventually crash and burn. In the real world, I have seen teams of world-class digital marketers, content writers, and creatives that have operated in businesses without a system of analyzing data. Despite the endless talent of these marketers, their team’s campaigns went nowhere, and their company’s performance ultimately struggled.
In this article, we will outline what successful marketing data analysis looks like and how you and your company can apply it. So, let’s jump in.
When I mention data and databases to marketers and business owners, I often see their skin crawl as if they accidentally wandered into a high school math class. The basics of databases aren’t that hard, and you need to know very little to use them correctly. Here’s what you should know — every database in the world follows this model:
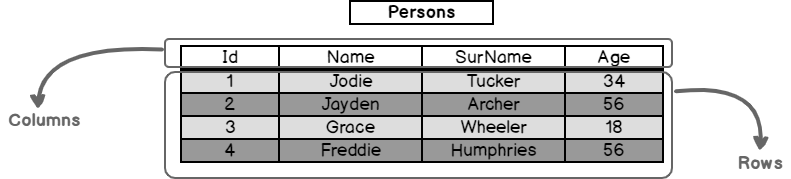
You might say, oh, that’s just a simple Excel table, right? Yes, that’s exactly how they are structured. Here’s the exact breakdown from database to a single point of raw data.
Raw data is the bedrock of your database, which means that it is the bedrock all of your analyses. Your business operations should systematically collect the raw data and structure it into a database like this. Without this proper organization, you are simply sitting on a pile of garbage data.
TL;DR: Understanding the basic structure of a database will allow you to get started on the right foot.
A KPI, or a Key Performance Indicator, is a metric used to evaluate the effectiveness of marketing strategies and campaigns. The most important KPIs can vary depending on the specific goals and context of a business. However, these are the ones I have used repeatedly for thorough decision-making:
With the metrics above, you can have a pretty good thumb on if your marketing is making the company money and how quickly and efficiently leads are turning into long-term customers. That’s what matters.
When we outlined our KPIs, you may have been asking — where is the website traffic? Where is the social media growth? What about email open rates? While my teams have always tracked these metrics, they are not KPIs. They are not the most relevant metrics to sales growth. They are seldom used in decision-making. They should only be considered when drilling deeper into a concern in your top level reporting.
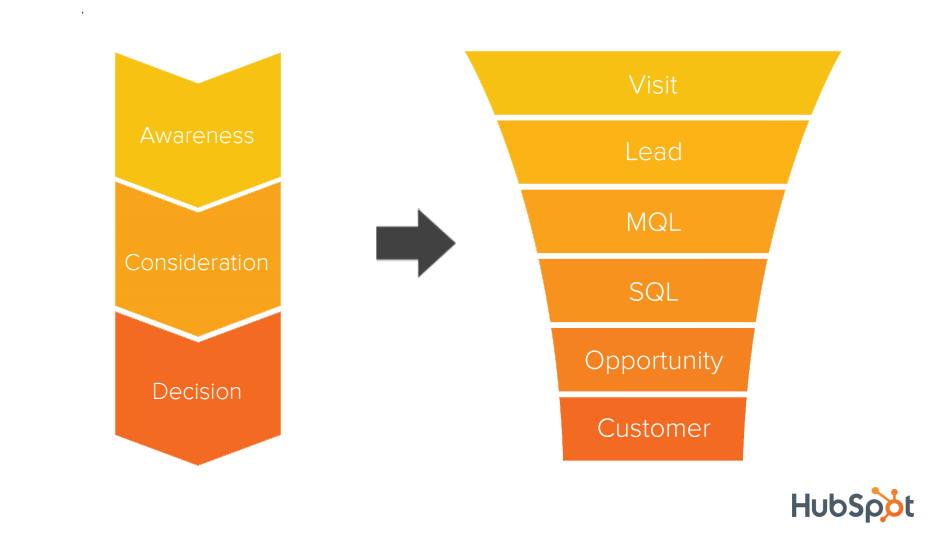
TL;DR: More data isn't always better; better data is better. Get started with the data that shows you if your marketing is making money and how far your leads are penetrating your marketing funnel.
Once you understand the structure of your databases and have outlined your KPIs, you are ready to analyze data. The data analysis process boils down to three important areas:
Being familiar with these stages can help you develop a routine process for analysis that ultimately can be automated.
As a marketer, you use different types of platforms to collect information on your prospective buyers. These tools could be web analytics tools, CRM systems, social media platforms, email marketing tools, e-commerce platforms, User behavior tracking, etc. As result, user data is living in Google, Meta, Shopify, Hubspot, Hootsuite, and 25 different platforms.
This is a blessing and a curse. These platforms handle much of the legwork for collecting clean, accurate data, but how the heck do we get these into a single view?
Many of the platforms in the last section have protocol that allows systems to communicate (aka APIs) across systems. These can allow all your platforms to live in one area. Unfortunately, this can become a time suck for marketers who do not have IT teams or experience with these types of protocols. If you’re reading this, I doubt you do.
To manage this data, I often recommend marketers to export data into CSVs. If you have outlines the categories of data needed, cleaning up the data in a spreadsheet is often and easier task than tinkering with APIs and workflows. At least, at the beginnings of your analysis. Once you have a standardized process down, it may be worth the effort to look into third parties or specialists who can connect APIs and automate data collection.
There are a thousand ways to skin a cat, and 10,000 ways to visualize a single piece of data. For simplicity and consistency, I’m going to recommend ways to visualize all your KPIs. These have worked repeatedly for me, and I could explain these charts to an executive or a skinned cat.
TL;DR: Start your data journey with a no-frills process that exports key marketing data into CSVs, cleans data in Excel, and visualizes using simple bar charts and funnel charts. Once this process is accurate and standardized, look into ways to automate.
In the realm of data-driven decision-making, here are the 10 fundamentals that can guide you towards more effective and strategic choices.
I have seen many great marketers surprised at how campaign results were widely different than our expectations. Sometimes things we think are terrible, hit home runs. Sometimes sure bets flounder. Leveraging data is not a destination, but rather a journey or a mindset. There is so much potential in analyzing unexpected metrics and having the ability to continuously learn and adapt.
If you would like to learn more about this concept, please follow me on Linkedin or sign up to receive my latest marketing guide, available at the bottom of this page. As always, it’s a pleasure to share these insights with you all, and I look forward to connecting.